

In the world of investing and finance, Earnings Per Share (EPS) is a financial metric used by investors, analysts, and fund managers to assess the financial health and performance of companies. Whether you are a beginner investor or a professional investor, this metric will help you analyse the company.
In this article, we will cover everything, like what Earnings Per Share is, its calculation, and use cases for better results and how it affects the share prices.
What Is Earnings Per Share (EPS)?
Earnings per share are a financial ratio that measures a company’s profitability per share. It is the portion of a company’s profit that is distributed to each share of stock. It shows how much profit each outstanding share of common stock has earned within a period.
Generally, a company with higher earnings per share is considered more profitable and becomes more attractive to investors. EPS becomes a more valuable tool when you compare different companies in the same industry.
Let’s assume two companies have the same number of outstanding shares – companies with higher EPS are considered undervalued stocks, and companies with lower EPS are considered overvalued stocks.

Formula and Calculation of Earnings Per Share :
Earnings per share are a company’s net income minus preferred dividends, and then multiplied by the number of total outstanding shares of the company.
EPS = net income – preferred dividends / total number of outstanding shares
Here!
Net income means total profits after paying all the taxes and expenses have been deducted by the company.
Preferred dividends are paid to the preference shareholders.
To calculate a company’s EPS, the balance sheet and income statement are the documents used to find the weighted average number of common shares, the net income of the company within a specific period, and the payment of dividends to preferred shareholders.
Example of EPS :
Suppose company ABC Ltd earned a net income of ₹ 1cr and it paid 20 lakhs as dividends to its preference share holders, and the company has 2 Lakhs common shares outstanding (weighted average) at the current period.
So, the EPS of ABC Ltd as per the EPS formula:-
EPS = {(1,00,00,000 – 20,00,000) / 2,00,000}
EPS = 80,00,000/2,00,000
EPS = 40 Rs. per share
Types of Earnings Per Share :
Earnings per share alone are not enough to determine a good stock. Therefore, EPS comes with several variations, and each of them highlights a different aspect of the financial parameter. This is because, depending on the specific use of EPS, the company’s stock valuation can be affected, indicating undervaluation and overvaluation.
1. Reported EPS or GAAP EPS :
This calculation is done using general accounting principles and is displayed in SEC filings. However, a company’s income can be distorted by GAAP.
To elaborate, income from a one-time sale of machinery can boost EPS if it is treated as operating income as per GAAP. Similarly, if business enterprises decide to treat important regular expenses as abnormal expenses, it will directly artificially inflate the earnings per share.
Reported Eps = ( net income – preferred dividends) / Weighted average common outstanding share
2. Ongoing Eps or PRO Forma Eps :
Current EPS, also known as pro forma EPS, is a modified measure of earnings that excludes one-time earnings or recurring items from companies’ financial statements. Generally, this type of EPS more accurately reflects companies’ financial health by excluding non-operating income, such as reinvesting profits from the sale of companies’ assets.
Ongoing Eps = ( Net Income – preferred dividends – one-time gains ) / Weighted average common outstanding share
3. Retained Earnings per share :
It shows the amount of the company’s profit that is not distributed as dividends among shareholders. Instead of distributing it as dividends, business owners reserve a portion of the profit to reinvest in the business at a future date.
Retained earnings per share are calculated by adding net income to current retained earnings and then subtracting the total dividends paid from it. Finally, the remaining amount is divided by the total number of outstanding shares.
Retained Eps = ( Net earnings + current retained earnings ) – dividends / weighted average common outstanding shares
4. Cash Earnings Per Share :
This is one of the most essential EPS that shows a better idea about the financial health of the company. This is because Cash EPS shows the exact amount of cash earned by the company.
Cash Eps = Operating Cash Flow/Diluted Shares Outstanding
5. Book Value EPS :
Book value is a metric that calculates earnings per share based on the book value of companies. Book value is the difference between a company’s total assets and total liabilities. It represents the value of a company’s total assets.
Book value is a financial tool that estimates the value of a company’s stock if it were to be liquidated.
Book Value EPS = (total equity – preferred equity) / weighted average common outstanding shares
Relationship Between EPS and The P/E Ratio :
In the world of investing, there is a direct relationship between earnings per share and the price-to-earnings ratio. These two financial metrics are deeply intertwined and are often used together to evaluate whether a stock is fairly valued, overvalued or undervalued.
The price-to-earnings ratio is calculated by dividing a company’s current share price by its earnings per share. This relationship tells us how much investors are willing to pay today for every rupee of earnings generated by the company.
Earnings per share show how much money the company has earned for each of its outstanding shares. And the price-to-emissions ratio shows how much investors are willing to pay for shares. It means that if the P/E ratio of a stock is 20. This means investors are willing to pay ₹20 for every ₹1 of the company’s earnings.
The significance of their relationship depends on valuation. A high P/E ratio indicates that the stock’s future earnings growth is high and, therefore, investors are willing to pay a premium today. It can also mean that the stock is overvalued compared to its actual earnings potential. On the other hand, a low P/E ratio may suggest that the stock is undervalued or that the company is facing growth challenges or risks.
Basic EPS vs. Diluted EPS :
Both basic EPS and diluted EPS are financial metrics used in the fundamental analysis of a company. Basic EPS is calculated by dividing a company’s net income after paying taxes by its weighted average number of outstanding shares.
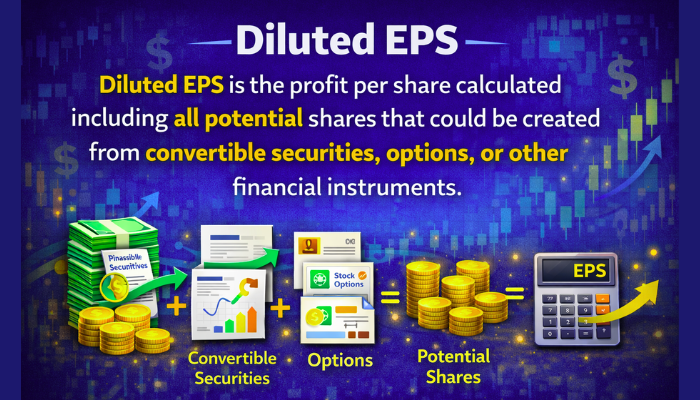
Calculating diluted shares requires considering all possible dilutions, such as warrants, coverable assets, and other diluted instruments.
To calculate the diluted EPS, take the company’s net income, then subtract preferred dividends from the net income. Then divide the results by the sum of the weighted average number of common shares outstanding and dilutive shares (convertible preferred stocks, warrants and other diluted items.
The shares that are created by the convertible debt should be included in the denominator of the diluted EPS calculation, but if this happened, the company would not have paid interest on the debt. In this case, the company or analyst would add the interest paid on the convertible debt back into the numerator of the EPS calculation so that the result is not distorted.
Importance of Earnings Per Share For Investors :
Earnings per share are one of the most common financial metrics used by investors or analysts. It is directly linked to the profitability of the company. EPS has many more significances:
- This helps investors earn more income by investing in companies that have higher earnings per share, meaning they are profitable or can increase dividend payouts over time.
- EPS serves as a basic building block for other important financial metrics. For example, it is used in calculating the price-to-earnings (P/E) ratio, which helps determine whether a stock is overvalued or undervalued. A rising EPS over time can signal a healthy company with growing profits, which is often rewarded by the market with a higher stock price.
- EPS also plays a crucial role in dividend policies. Companies with consistent and rising EPS are more likely to pay dividends to shareholders.
- EPS not only tracks the current valuation of a company, but it also tracks the past valuations of companies.
What Is a Good Earnings Per Share Ratio?
Well, EPS is not a fixed number or a straightforward one; it depends on many company and business factors, such as the recent performance of the company and its industries, the performance of its competitors and analysts’ expectations for the stock. Sometimes, a company might report rising EPS, but the stock price could fall if analysts were expecting an even higher number.
A good EPS reflects steady and sustainable growth over time. Investors generally prefer companies that consistently increase their EPS year after year, as this reflects the company’s financial health, efficient management, and increasing profitability. Additionally, comparing a company’s EPS to its peers and industry averages is essential to make a proper assessment. If a company’s EPS is significantly higher than its peers’, it may indicate operational superiority or better cost management.
Finally, a good EPS should be viewed in the context of other financial metrics such as the P/E ratio, return on equity (ROE), free cash flow, and revenue growth to get an overall view of a company’s financial health and investment potential. It is important to always judge EPS in relation to the company’s share price, such as by looking at the company’s P/E or earnings yield.
Limitations of Earnings Per Share :
Without any doubt, the metrics EPS come with some limitations, like other financial tools. These are some of the limitations of earnings per share:-
- EPS does not reflect a company’s actual cash flow. Due to accounting adjustments such as depreciation or non-cash revenues, a company may appear to have strong EPS even if its cash flow is weak.
- A company can manipulate its EPS by buying back stock, reducing the number of shares outstanding, and inflating the EPS number at the same earnings level.
- EPS does not consider the size of the company. A large company with a low EPS can still earn more total profit than a small company with a high EPS. Therefore, other metrics such as return on equity (ROE) or free cash flow (FCF) should be used along with EPS for a more comprehensive analysis.
The Conclusion :
Earnings per share are an important financial metric for analysing stocks. EPS is calculated by subtracting preferred dividends from a company’s net income and then dividing by the average common shares outstanding. EPS is used by investors, analysts or institutions to determine a company’s financial health and cash flow.
While EPS is a powerful tool, you should always use other tools such as the P/E ratio, return on equity (ROE), cash flow or debt levels along with EPS to analyse a company more effectively. By understanding the types of earnings per share, how they are calculated, and what they represent, investors can better assess a company’s financial strength and make better investment choices.

My name is Prabhat Mehta, and I’m from Jharkhand, India. I’m a CFA Level 1 candidate and currently pursuing a Bachelor of Commerce (B.Com) with a specific academic focus on financial analysis, corporate finance, and investment fundamentals.
I have a passion for studying and analysing financial markets, company valuation, and fundamental analysis. I feel immense joy and energy whenever I engage in these activities. I write articles to explain complex financial concepts simply and clearly, providing practical explanations to help investors avoid common mistakes and make better financial decisions.
Most retail investors struggle not because of a lack of funds, but because of a lack of clear financial understanding—they don’t know what investing is, how to get started, or how to select undervalued stocks with good growth potential. My work is to focus on solving those problems.
Investing isn’t just about investing in a single asset. I believe investing should be logical, disciplined, and knowledge-driven rather than emotional. Through continuous learning and real-world analysis, my aim is to foster sound financial thinking and share information that truly helps investors grow with confidence over time.
Such a great article , Thanks unity wealth capital for spreading this level of information with us. Information available in the article in increases my understanding in EPS.