
In the world of investing, before investing your hard-earned money in any stock, you must thoroughly check the fundamental health of that stock (business).
The price-to-earnings ratio is a valuation metric used to analyze whether a company’s shares are overvalued or undervalued. The price-to-earnings ratio is a valuation tool used by investors around the world to analyze companies.
What is the Price to Earnings (P/E) Ratio?
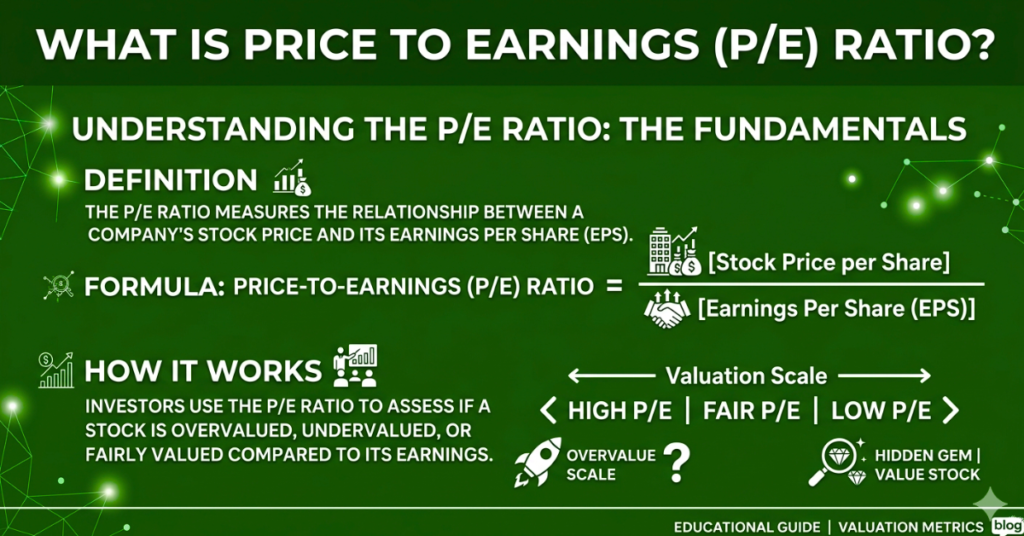
The price-to-earnings ratio is a ratio that measures a company’s current share price to its earnings per share (EPS). The price-earnings ratio helps investors and analysts assess the actual value of stocks. The PE ratio is a financial valuation metric that helps us to compare a company’s valuation to other firms within its industry or benchmark indices.
Suppose you buy shares of a company at a P/E ratio of 10. Then you are paying Rs. 10 to that company for earning Rs. 1. This means that the company does business of Rs. 1 in a year from the Rs. 10 given by you. Price-to-earnings ratio (p/e) signifies the amount of money that an investor is willing to invest in a single share of a company for Re. 1 of its earnings.
Formula of Price-to-Earnings Ratio :
P/E ratio formula:- (Current market price of the share / Earnings per share)
To determine the pe ratio – divide the stock price by its {EPS}
Example –
For Example, according to June 2025, SBI Bank’s share price is 800, and its earnings per share are 87, so the p/e ratio of the stock is:
p/e ratio = (800/87) = 9.19
So, the price-to-earnings ratio of the SBI bank is 9.19. This means that investors are ready to buy the share price of the company at a price 9 times more than its earnings. If the company does not grow and the current level of earnings remains constant, it will take 9 years for the company to pay back the amount paid for each share by investors at a P/E of 9. The P/E ratio is interpreted as the number of years it will take for the company to pay back the amount paid for each share.
Uses of P/E Ratio :
The price-earnings ratio is one of the most widely used financial metrics tools used by every investor and analyst to review a stock’s valuation. It helps to determine whether a stock is overvalued or undervalued.
If the stock price rises much faster than the growth in earnings, then the PE ratio becomes high. And if the stock price falls much faster than the growth in earnings, then the PE ratio becomes low. A high P/E ratio means that the stock is expensive or overvalued and may fall in the future. A low P/E ratio means that the stock is undervalued or cheap, or it may rise in the future. P/E ratios are most valuable when comparing similar companies in the same industry or for a single company over time.
Let`s Breakdown – “ What is a Good P/E Ratio ?”
What is a good P/E ratio? It is a question that all investors want to know the answer to. When they analyze any stock, a common question they have in mind is what is the best P/E ratio for this stock?
The good P/E ratio of a company depends on various current market conditions, such as the industry average of P/E ratios, the nature of the industry, and market trends. When investors assess different P/E ratios, they should consider how the other companies in the same industry with similar characteristics and in the same growth phase are performing.
So, there is no proven good P/e ratio that investors can rely on when investing in the stock market. The good p/e depends on the industry.
{It is not always important that if P/E is high, it means the stock is overvalued. Or if P/E is low, it means the stock is undervalued. Sometimes you come across a monopoly business that may have a high P/E. So, you always need to analyze the company’s annual report or compare it with its peers.}
Types of P/E Ratio :-
There are primarily two types of price-to-earnings ratio which are used by investors to take into consideration.
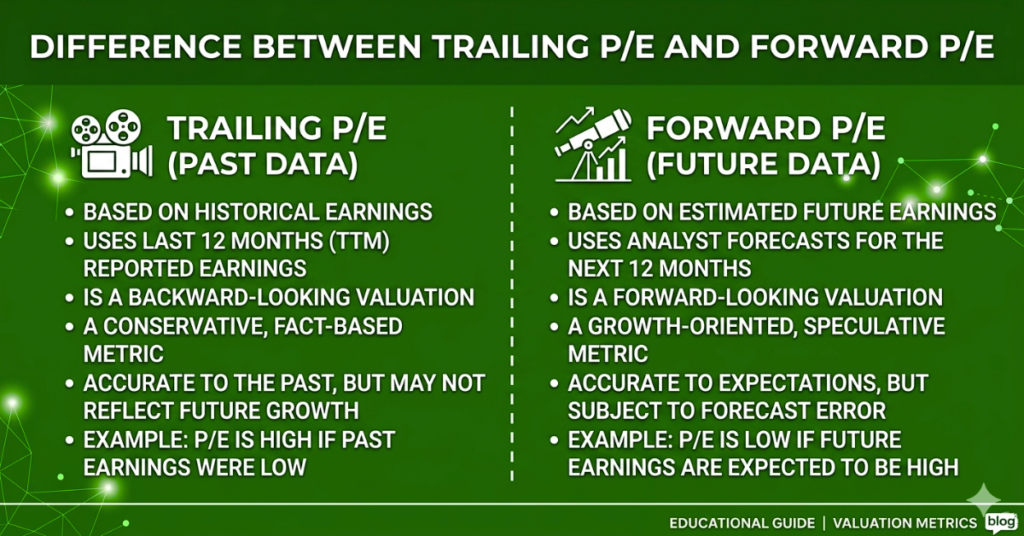
- Forward price to earnings ratio: The forward P/E ratio is calculated by dividing a company’s stock price by the company’s estimated earnings, which are derived from future earnings guidance. It is also called the “estimated price-to-earnings ratio”.
Since these ratios are based on a company’s future earnings, investors use forward price-to-earnings ratios to evaluate companies’ expected future performance and growth rates without any changes or other accounting adjustments.
Forward P/E = Current Share Price /Estimated EPS for next year
- Trailing Price-to-Earnings Ratio:- The trailing P/E ratio is based on the company’s past performance, dividing the company’s current share price by its total earnings per share over the last 12 months. The trailing P/E ratio is the most common ratio used by most investors.
The trailing P/E ratio will change as the price of a company’s stock moves because earnings are released only each quarter, while stocks trade whenever the market is open. As a result, some investors prefer the forward P/E. If the forward P/E ratio is lower than the trailing P/E ratio, analysts expect earnings to increase; if the forward P/E is higher than the trailing P/E ratio, analysts expect them to decline.
Trailing P/E = Current Share Price/ EPS of last 12 months
Absolute P/E Ratio v/s Relative P/E :
Absolute Price- to-Earnings Ratio :
The absolute P/E ratio is the company’s actual P/E ratio. It is calculated by dividing the company’s current share price by its earnings per share. EPS is taken from the last 12 months (trailing) or projected for the next year (forward). The absolute P/E represents the P/E of the current period.
This ratio is used as a benchmark to determine whether the stock is overvalued, undervalued, or fairly valued relative to its earnings.
Relative Price-to-Earnings Ratio :
The relative price-to-earnings ratio is a ratio that compares a company’s absolute price-to-earnings ratio to its benchmark, such as the historical average P/E, the industry average, or the market P/E. The relative P/E shows what portion or percentage of the past P/Es the current P/E has reached. Investors might also compare the current P/E to the bottom side of the range, measuring how close the current P/E is to the historic low.
Limitation of Price-to-Earning Ratio:
P/E ratio helps us to analyse whether a company’s stock is overvalued or undervalued, but like any other financial tool, P/E ratio also comes with some limitations.
We cannot invest in any company based on only one financial metric tool, i.e., P/E Ratio, because P/E Ratio is calculated by the company’s earnings and the earnings report of the company comes in a quarter (3 months), but the share price of the company fluctuates on every market day, so the P/E ratio might not agree with a company’s performance for a long time.
There is also a limitation to using the P/E ratio, which is that it does not consider a company’s EPS growth rate, which is why investors use the PEG ratio (price to earnings to growth) to decide which company is more promising for long-term growth.
Companies that are not profitable and have no earnings, or negative earnings per share, pose a challenge in calculating P/E. There are varying opinions among analysts on how to deal with this. Some say P/E is negative, others say P/E is 0, while most say P/E does not exist until a company becomes profitable (N/A).
Final Conclusion :
The P/E ratio is the most important financial metric for analysing a business. It is calculated by dividing the company’s current share price by its latest available earnings per share. This ratio helps investors determine whether the stock price is high or low compared to its earnings. It also helps in comparing companies in similar industries. E.g., energy to energy, technology to technology, etc. While it helps in estimating valuation, smart investors combine it with other metrics like PEG, P/B, and cash flow analysis.
This article is for educational purposes only and does not constitute financial advice. Please consult a SEBI-registered financial advisor before making any investment decisions. All return figures are indicative and based on market conditions as of April 2026.

My name is Prabhat Mehta, and I’m from Jharkhand, India. I’m a CFA Level 1 candidate and currently pursuing a Bachelor of Commerce (B.Com) with a specific academic focus on financial analysis, corporate finance, and investment fundamentals.
I have a passion for studying and analysing financial markets, company valuation, and fundamental analysis. I feel immense joy and energy whenever I engage in these activities. I write articles to explain complex financial concepts simply and clearly, providing practical explanations to help investors avoid common mistakes and make better financial decisions.
Most retail investors struggle not because of a lack of funds, but because of a lack of clear financial understanding—they don’t know what investing is, how to get started, or how to select undervalued stocks with good growth potential. My work is to focus on solving those problems.
Investing isn’t just about investing in a single asset. I believe investing should be logical, disciplined, and knowledge-driven rather than emotional. Through continuous learning and real-world analysis, my aim is to foster sound financial thinking and share information that truly helps investors grow with confidence over time.